Here we are again with another update on our Stay at Home Directive, which now has been extended until May 4th. It might seem like so far away, but the more we stay home (and the better we follow the rules), the sooner we will be able to resume our regular lifestyles!
I’m continuing with week 3 of looking at specific data from Bellingham, Ferndale and Lynden to observe the affects COVID-19 has on the current housing trends. You’ll find the updated charts below and my comments regarding them. However, before we get into the nitty gritty, watch the video below for some good news!
BACK TO THE DATA
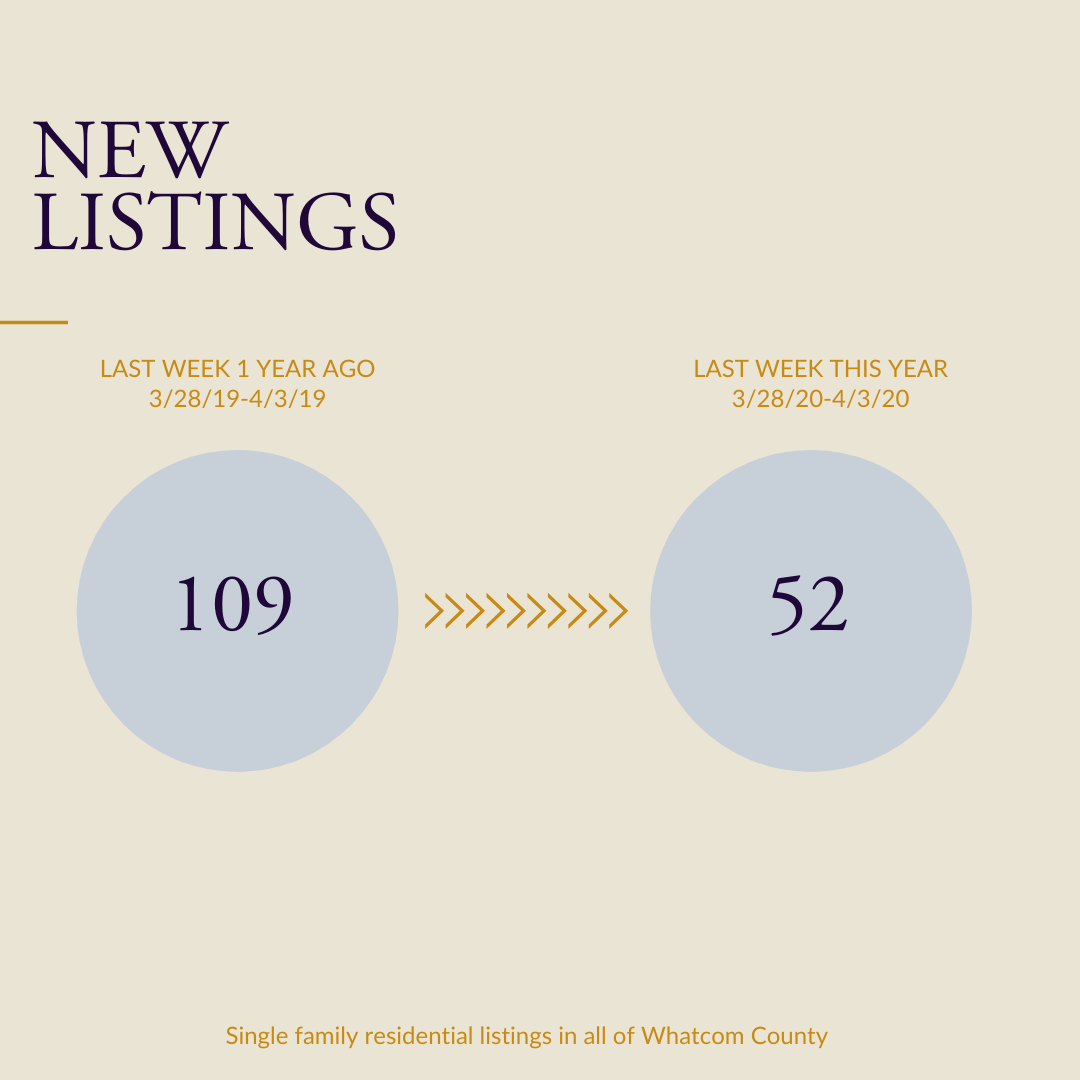
As we are in an ever-changing climate (it seems day-to-day), I want to reiterate that the BEST time to list a home for sale, I believe, will be 1 week after the Stay Home Directive is lifted. As Economist Matthew Gardner has stated in his Monday Update this week, “We are currently in a Health Crisis, NOT a Housing Crisis.” Most things in our life right now, unless they were already in process or are essential, have been put on hold. When we are able to get back to “normal life” that will all start back up again. New listings will go active, and buyers will be ready as ever to find a new home! As I projected last week, the numbers have dwindled slightly, but not significantly as you’ll see below.
UNDER CONTRACT
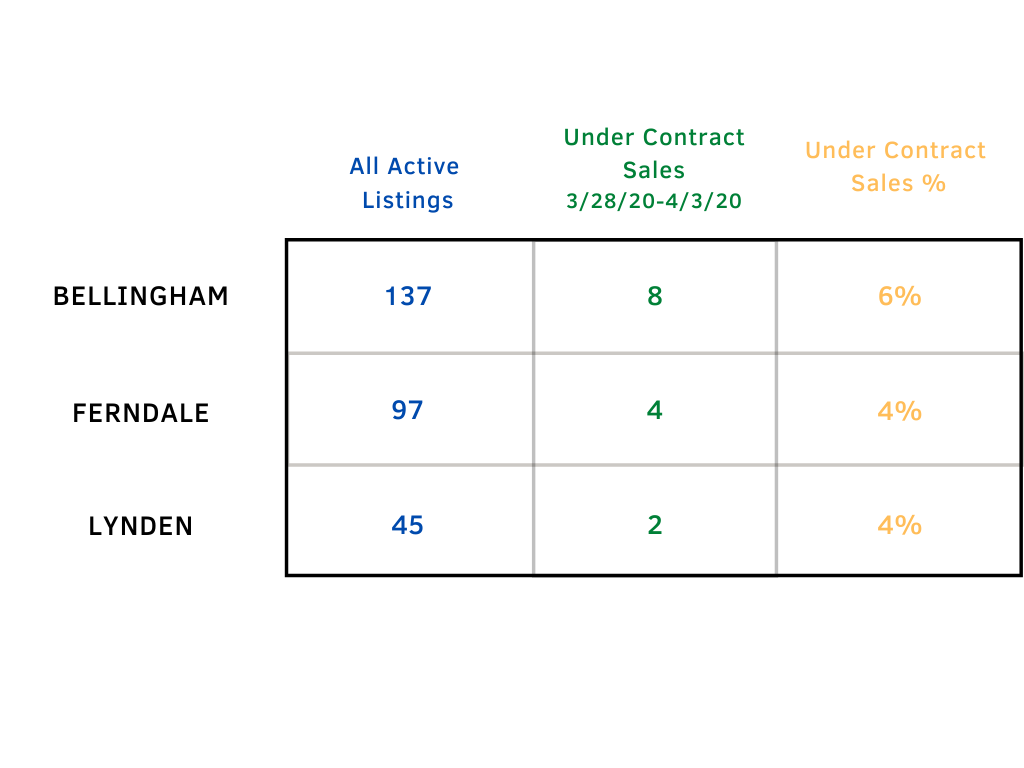
Below is an accounting of all of the active listings on the market in our three major markets along with all of the sales that went under contract from 3/28/20 to 4/3/20 (pulled around Noon PST) and the percentage relationship between those numbers. Our Under Contract Sales have continued to fall, this week’s pendings are half of what last week’s were. This is a direct connection to the Health Crisis and is no real surprise.
ADOM
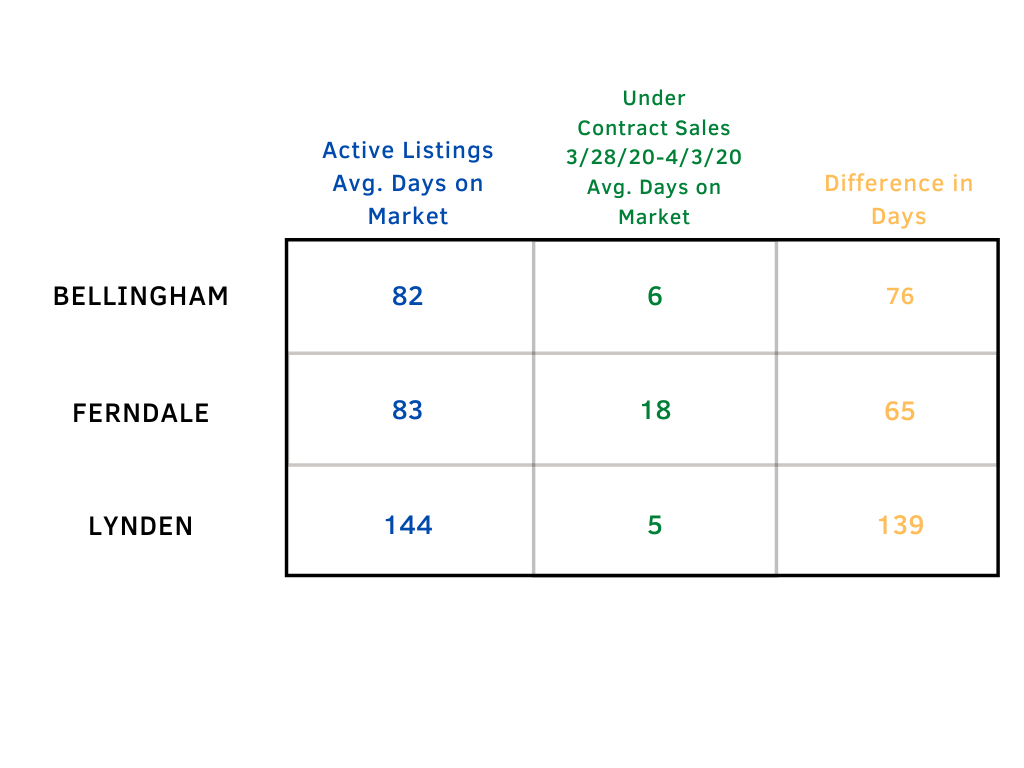
The second chart represents the Average Days on Market (ADOM) for the homes that are currently active and that went under contract between 3/28/20 and 4/3/20. “Days on Market” is how long the home was active on the market before the seller accepted an offer. The difference in ADOM bounced back to numbers looking similar to two weeks ago which is that homes that are coming on the market, appropriately priced are selling quickly. Homes that came on in the last week in Bellingham and Lynden accepted offers this same week- there are buyers out there!
% PRICE DIFFERENCE
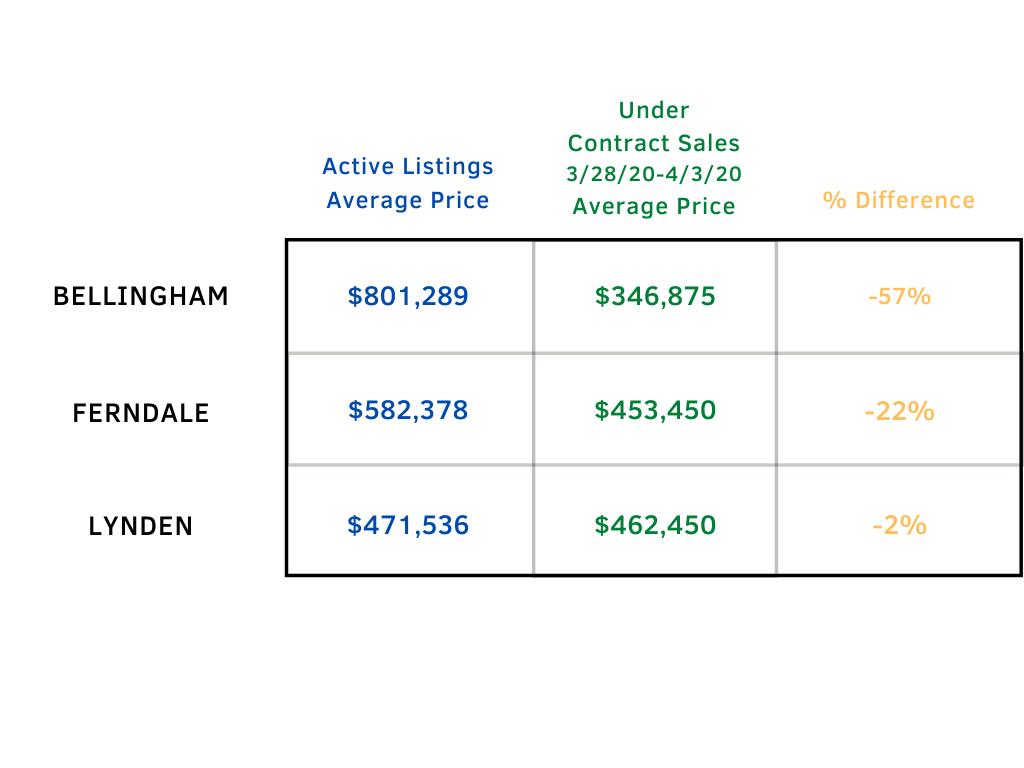
The last set of data below is the average prices of the active listings and the average prices of the homes that went under contract last week. What we are mostly paying attention to here is how the % difference is changing from week to week to see how COVID-19 might be affecting the offer price that homes receive. Most significant here is the Under contract pendings average price for BELLINGHAM- I can’t remember the last time any average price in Bellingham was this low.

 Facebook
 Twitter
 Pinterest
 Copy Link