Data, Tours, Taxes and Interest Rates
Most prominent in the news this last week was Washington State deciding that our students will not return to in person schooling this school year. Families are mourning sadness of missing out on the end of year celebrations for milestone grade transitions, cancelled sports seasons and so much more. I’m with you all experiencing some of this sadness and if there is any way I can support you or help you celebrate something, please let me know!
This is week 4 of analyzing data in Whatcom County to observe the affects of COVID-19 on our housing market.
BACK TO THE DATA
Numbers seem to be going up! Whatcom County total homes that went Active this week rose from 52 to 95, which is a pretty big jump in one week considering our current situation! There is now only a difference of 21 homes from last year to this year. 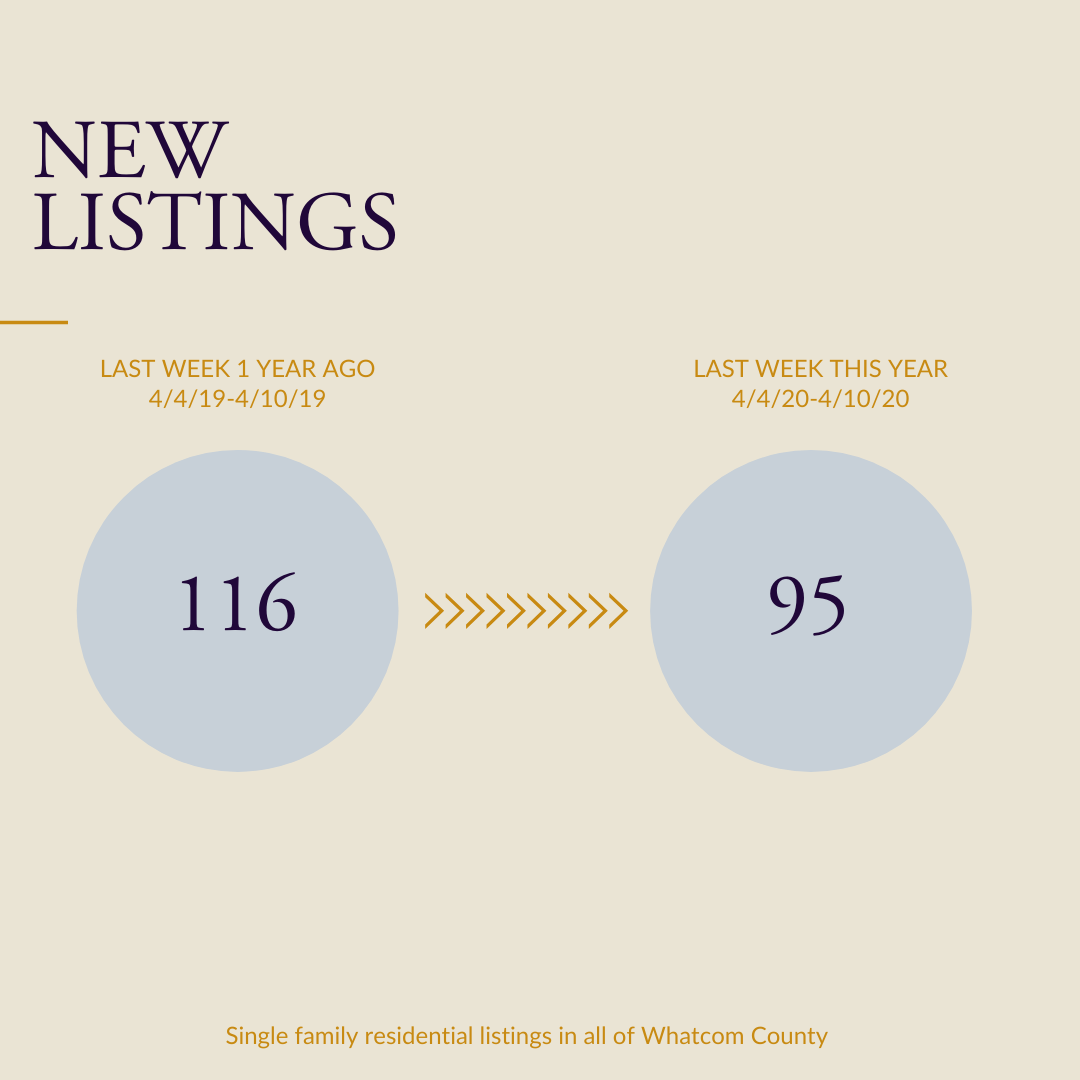
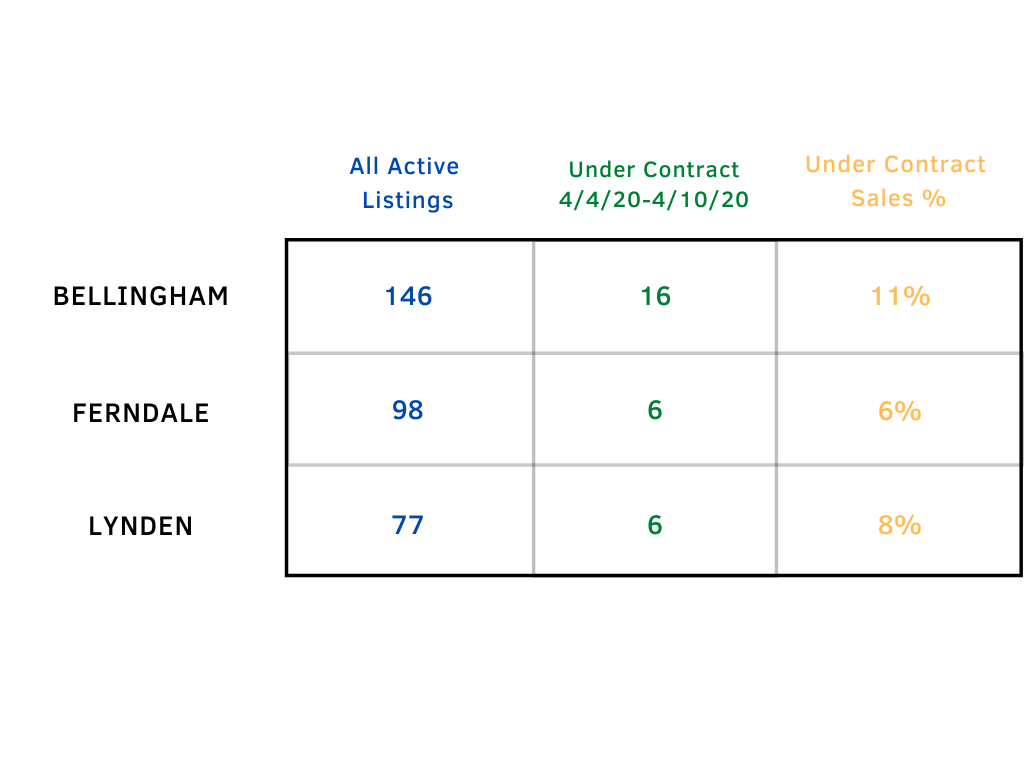
UNDER CONTRACT
Below is an accounting of all of the active listings on the market in our three major markets along with all of the sales that went under contract from 4/4/20 to 4/10/20 (pulled around Noon PST) and the percentage relationship between those numbers.Remember when Real Estate wasn’t deemed an “Essential Business,” and numbers went down? Well, look what happens when we are “Essential” again! Please know that we are all taking great caution and limiting exposure to families by only taking clients into others homes that have urgent housing needs. Pendings are back up! The Under Contract numbers for Bellingham doubled since last week, and Lynden has 32 new active listings!
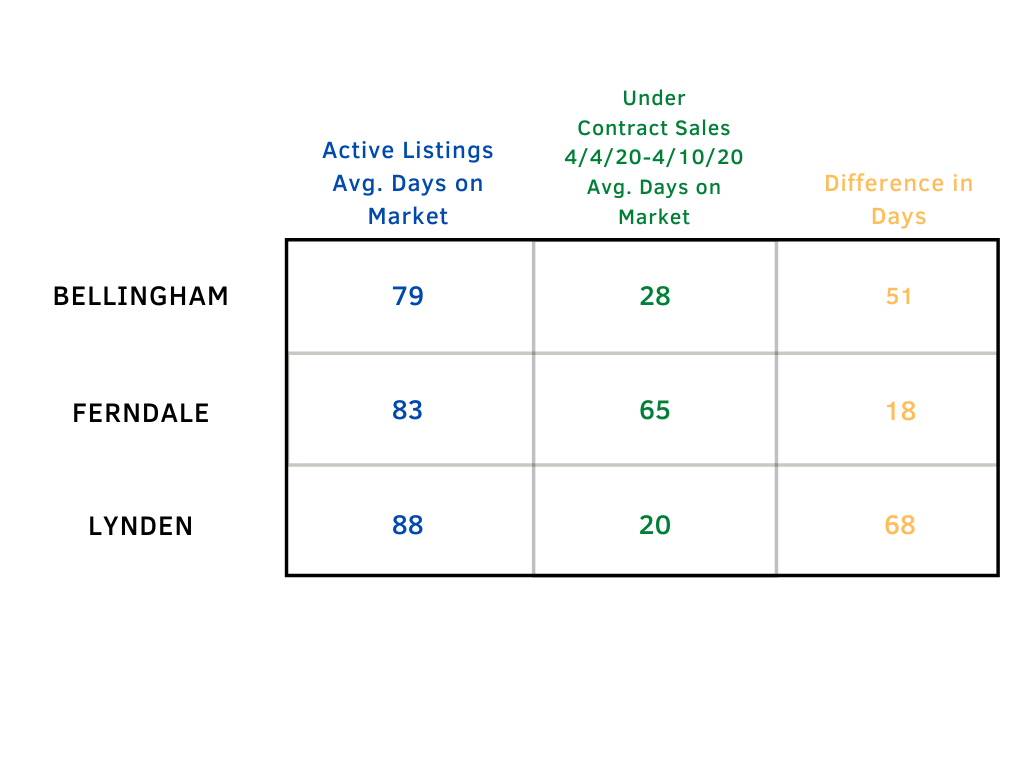
ADOM
The second chart represents the Average Days on Market (ADOM) for the homes that are currently active and that went under contract between 4/4/20 and 4/10/20. “Days on Market” is how long the home was active on the market before the seller accepted an offer. The difference in DOM numbers have dropped this week, telling us that more homes that were on the market for a long time have sold, and new houses are moving faster.
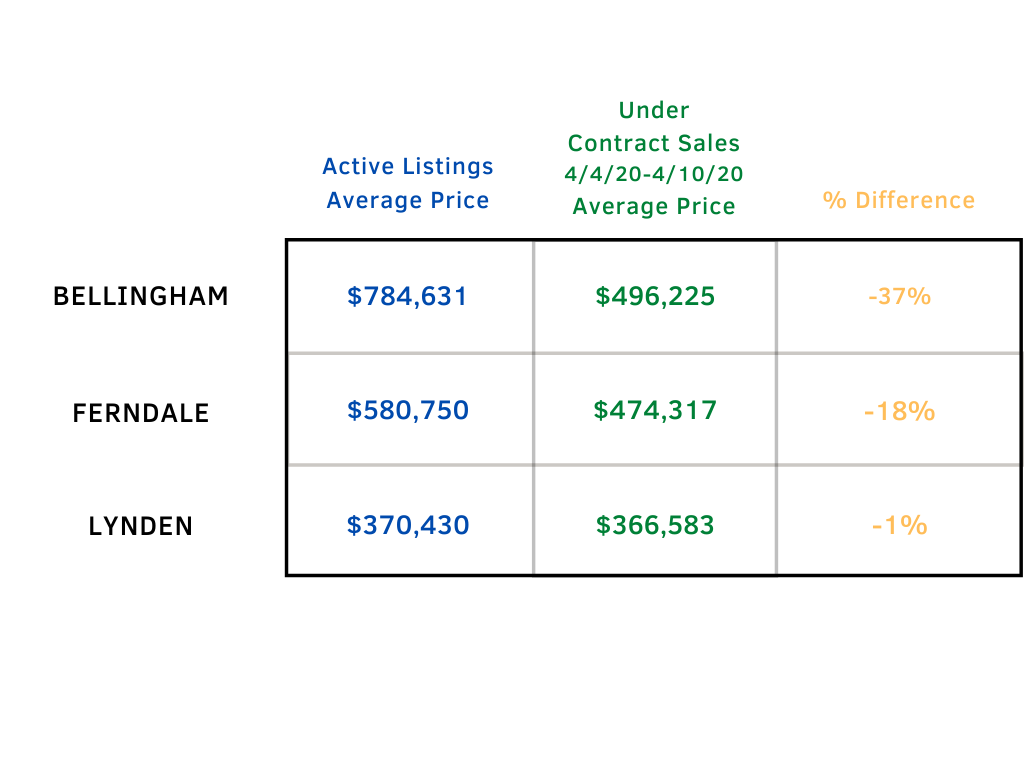
% PRICE DIFFERENCE
The last set of data below is the average prices of the active listings and the average prices of the homes that went under contract last week. What we are mostly paying attention to here is how the % difference is changing from week to week to see how COVID-19 might be affecting the offer price that homes receive. Bellingham numbers are looking closer to normal (some higher priced homes pended this week). There is now only a 37% difference between the Actives averages and the Under Contract averages. And Lynden had a similar change in prices as Bellingham did last week- the Average Active Listing and Under Contract Price went down by about $100,000.

 Facebook
 X
X
 Pinterest
 Copy Link